Relative Strength (RS) Charts and Their Application in Trading
Relative Strength charts are key tools in intermarket analysis and technical analysis, enabling traders to evaluate the performance of one asset relative to another. This comparative analysis helps identify market leaders and laggards, allowing traders to allocate capital more effectively and align their strategies with prevailing market trends. This article explores the concept of RS charts, their construction, interpretation, and practical applications in trading.
What Are Relative Strength Charts?
RS charts display the ratio of the price of one asset to another. For example, a typical RS chart might compare the performance of a stock to its benchmark index (e.g., a stock’s price divided by the S&P 500 index). The resulting chart shows whether the stock has been outperforming or underperforming the index over time.
Another example is a gold-to-silver chart, which illustrates the performance of gold relative to its counterpart, silver.
RS charts can also compare sectors, asset classes, or currencies. This feature makes these charts invaluable for traders seeking opportunities across diverse markets.
Construction of RS Charts
Creating an RS chart involves a simple calculation:
The result is plotted as a chart over time. For example:
Stocks vs. Index: For instance, the Apple/NASDAQ chart evaluates Apple’s stock performance relative to the NASDAQ index.
Sector vs. Market: To assess the performance of the technology sector against the S&P 500, locate the ETF representing the tech sector (e.g., XLK) and plot its ratio against the S&P 500.
Currency Pairs: Compare the strength of EUR/USD against USD/JPY.
Correlated Assets: For example, the XAU/XAG chart illustrates the performance of gold relative to silver.
While most analytical charting platforms allow users to easily create RS charts, only a few brokers enable trading directly based on these charts. If a broker provides such a facility, it offers a significant competitive edge.
Interpreting RS Charts
RS charts help traders identify trends and turning points in relative performance. Key signals include:
Uptrend: An upward-sloping RS line indicates that Asset A is outperforming Asset B, potentially signaling a buying opportunity.
Downtrend: A downward-sloping RS line signifies underperformance, potentially signaling a selling opportunity.
Breakouts: When the RS line breaks above resistance or below support, it may indicate significant shifts in relative performance.
Divergences: If the RS chart diverges from the asset’s price chart, it can signal a potential reversal or weakening trend.
Overbought/Oversold Levels: If the RS chart for two correlated assets reaches extreme levels, it may indicate an imminent reversal or trend change.
How to Trade Using RS Charts
Identifying Market Leaders: RS charts help identify assets that outperform their peers or the broader market. Traders can focus on these leaders to follow strong trends. Example: If the RS chart of a tech stock against the NASDAQ shows consistent outperformance, it may be a good candidate for a long position.
Avoiding Market Laggards: Traders can use RS charts to avoid or sell underperforming assets, improving overall portfolio returns. Example: A downward-sloping RS chart for a sector ETF compared to the S&P 500 may signal a bearish outlook.
Reversal Trades: RS charts can support mean-reversion strategies. For instance, the gold-to-silver (XAU/XAG) chart is inherently range-bound, with either weak trends or quick reversals. Traders can design strategies such as grid trading or oversold/overbought-based trading to capitalize on low-risk opportunities in such charts.
Advantages of RS Charts
Simplicity: Easy to calculate and interpret.
Versatility: Applicable across various markets and asset classes.
Trend Identification: Helps identify market leaders and laggards.
Relative Strength charts are powerful tools for traders looking to optimize strategies and improve performance. By identifying trends in relative performance, traders—particularly those with a reversal approach—can focus on high-probability opportunities and generate favorable returns relative to the risks they undertake.
When combined with other forms of analysis, RS charts become an essential part of any trader’s toolkit. Whether trading stocks, sectors, currencies, precious metals, or energy, mastering RS analysis can provide a significant edge in today’s competitive markets.
Make sure to activate your VPN if you are our valued customer from Iran
Pipwise Broker
A Leader in Providing Relative Strength Assets and Market Power Analysis
If you are looking for a powerful tool to identify golden opportunities in financial markets, Pipwise Broker takes you to a new level of analysis and trading. By offering Relative Strength (RS) assets, Pipwise empowers traders to professionally analyze the performance of assets in comparison to one another and capitalize on opportunities based on Mean Reversal strategies.
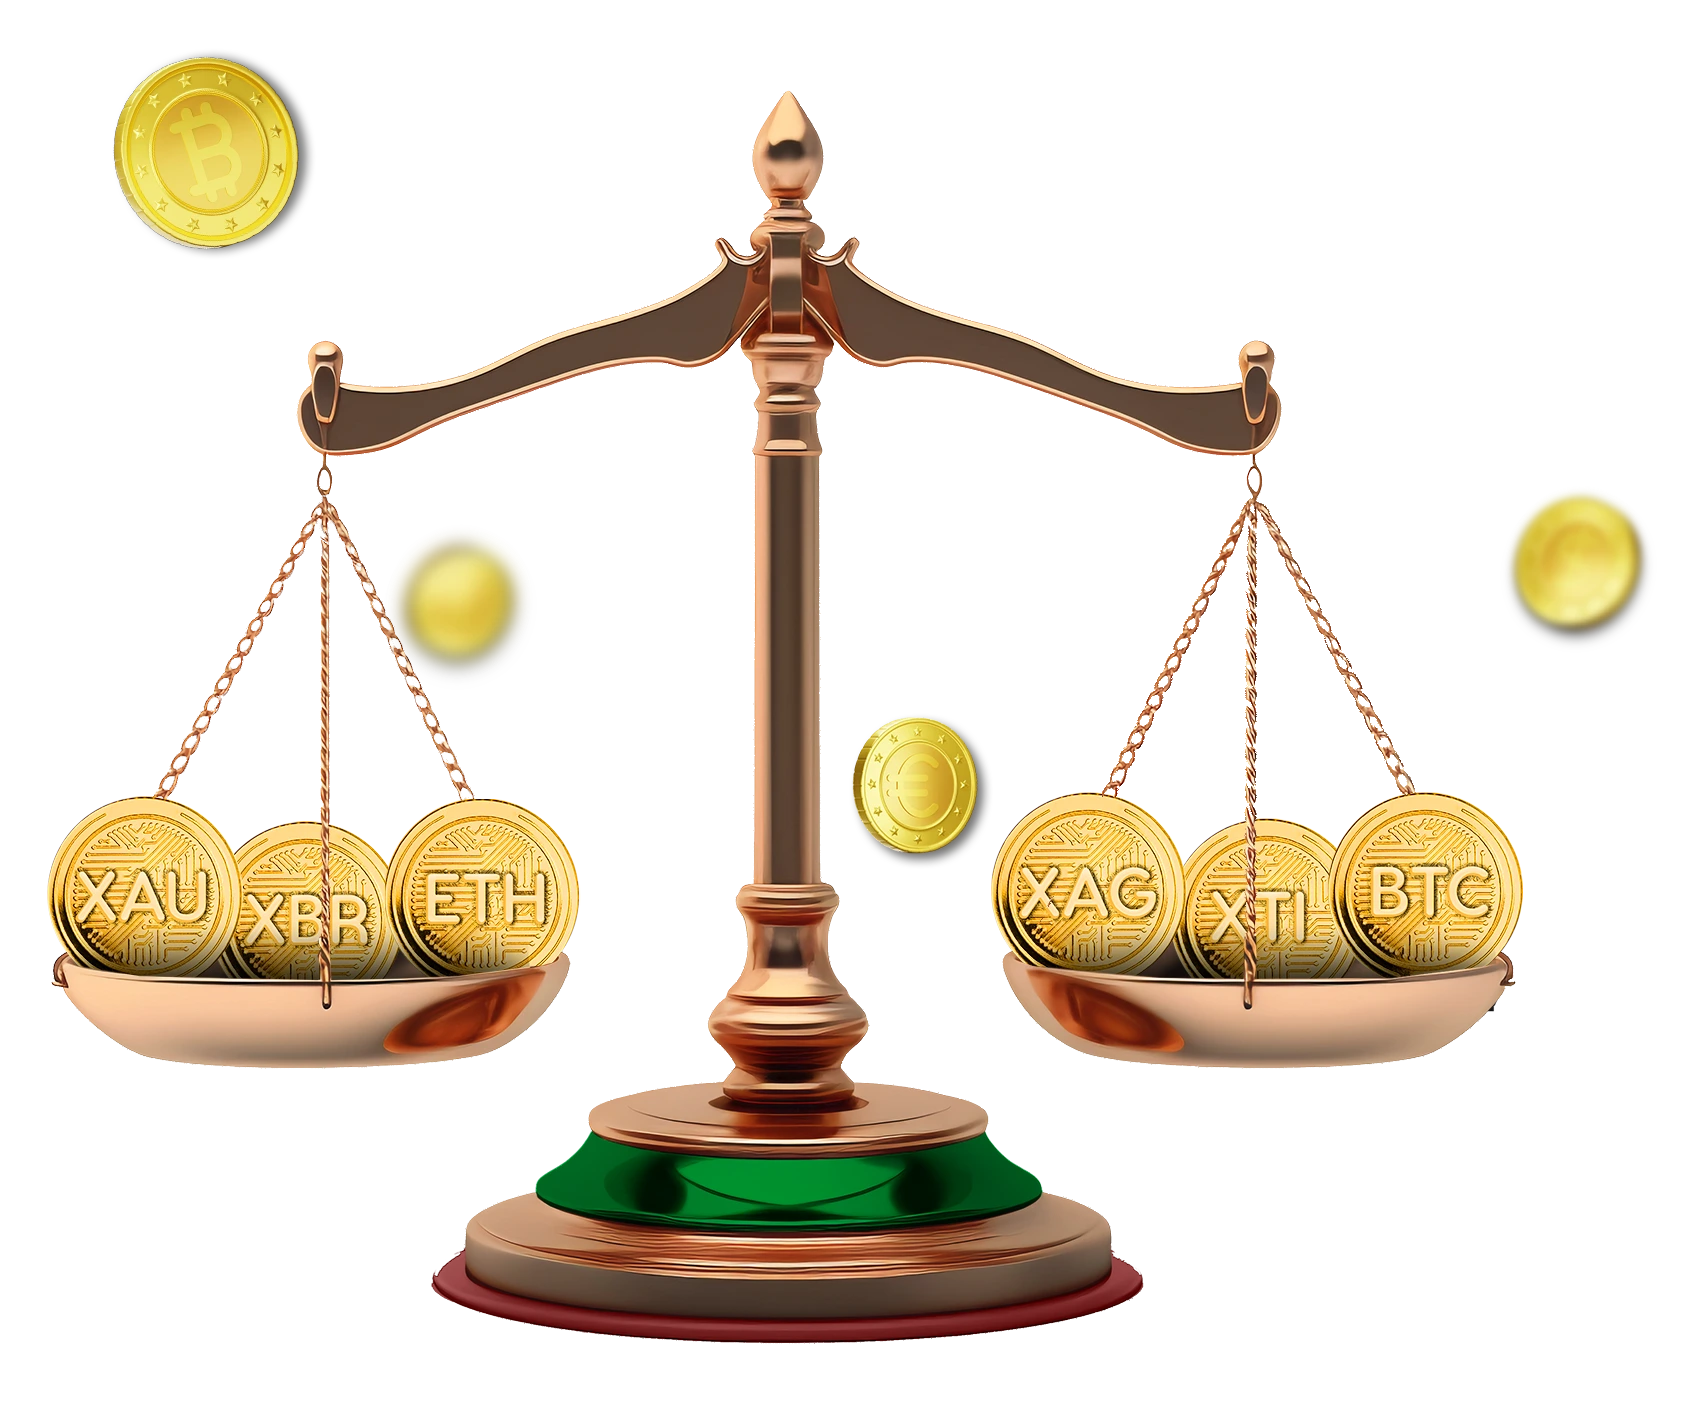
Currently, Pipwise Broker provides three exclusive Relative Strength assets:
Gold to Silver (XAUXAG)
Brent Crude Oil to West Texas Oil (XBRXTI)
Bitcoin to Ethereum (BTCETH)
In the near future, the number of Relative Strength assets offered by Pipwise will expand. Additionally, specialized training courses on designing and implementing trading strategies for these assets will be introduced.